
Understanding the Pressure-Volume Diagrams
The pressure-volume diagram (abbreviated as the P-V diagram) is a graphical representation of the changes in pressure with respect to volume in a closed system. P-V diagrams are useful for determining the efficiency of a system and/or the work done by or to a system.
The classic example given is of a cylinder and a piston with some type of gas enclosed in the chamber.
Recall that the work of a process in a closed system from state 1 to state 2 is represented mathematically by:

Or in other words, the P-V diagram graphically represents work done by or to the system as the area under the P-V curve. In the example of the cylinder and piston under different circumstances, we can represent some ideal, common processes in thermodynamic systems. The 4 most common processes are:
Isobaric (constant pressure) – called an Isobar
Isothermal (constant temperature) – called an Isotherm
Isometric – (constant volume) – also called Isochoric
Adiabatic – (no heat exchanged) – called an adiabat

Isobaric Process
The isobaric process can be represented as an isobaric expansion and an isobaric compression. An isobaric expansion is a state change within a system representing a constant pressure and an increase in volume. An isobaric compression represents a constant pressure and a decrease in volume.
Following the example of the cylinder and piston, this process can be represented experimentally by placing a constant weight on the piston and recording the volume change and pressure change. Graphically this will look like:
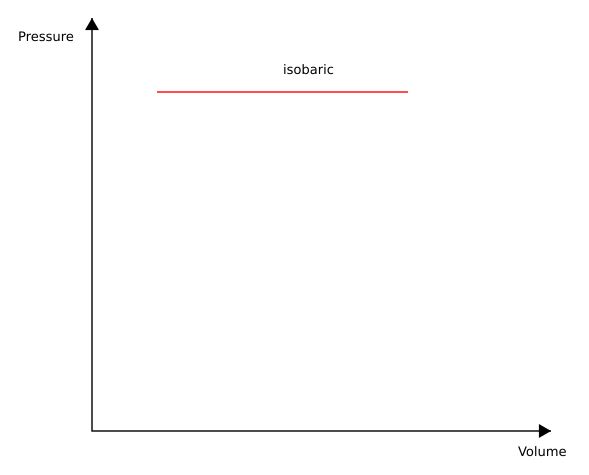
The work produced or removed from the system is represented by the area under the curve. The area is represented mathematically as the integral of the function of the curve from point 1 to point 2 (or state 1 to state 2). In this case, the area is simply the area of a rectangle:

The work found through this experimental process can be used in the first law of thermodynamics.
Isothermal Process
The isothermal process is represented by a P-V curve at constant temperature. As pressure changes and volume changes within a closed system, heat is being added to or removed from the system and/or work is being done by or to the system which will affect the temperature of the gas enclosed.
The isothermal process can be an expansion or a compression.
Represented by the first law of thermodynamics, it is known that the internal energy is proportional to the temperature. Therefore, the change in temperature is equal to the change in internal energy, and the first law can be rewritten as:

Where Q is the heat added to the system and W is the work done by the system. Based on the mathematics, we know that the work and heat from state 1 to state 2 must be equal to maintain a constant temperature in the system.
To understand mathematically how the isothermal curve looks, the ideal gas law can be employed.

n, R, and T (amount of gas, ideal gas constant, and temperature respectively) are all constants. Therefore, the isothermal process can be represented mathematically as:

Graphically:

Isometric Process
The isometric process can be achieved by maintaining constant volume in a system. Because there are no moving parts, or all moving parts produce a reaction that an equal and opposite amount of work, it is known that the work done by or to the system is equal to 0.

Because work is equal to 0 and it is known that the work done between 2 states is equal to the area under the P-V curve, the process will be graphically represented as:

Adiabatic Process
The adiabatic process represents a state change within a system where there is no heat exchanged. Therefore, Q is equal to 0 and it is known that the change in internal energy is simply equal to work.

Therefore, the system will only involve moving parts, and the heat exchange will be nonexistent. To achieve this, either the system is perfectly insulated, or the state change is completed so fast that there is no time for heat to be exchanged through the system boundary.
Graphically, this looks like a steeper version of the isothermal process, as temperature will increase or decrease.

Jarrett Linowes
Mechanical Engineer
omniamfg@gmail.com
Did I miss anything you are interested in? Send me an email or comment below!


